

Root Cause Analysis for Outbound Sales Teams [2025]
Stop prescribing solutions. Learn this diagnostic framework to find WHY top reps outperform others and 2X your team's conversion rates.

👋 Welcome to a 🔒 paid edition 🔒 of my weekly newsletter Outbound Kitche. Each week I dive into reader questions about creating outbound systems for sustainable growth. For more: Podcast | Launching Outbound | Scaling Outbound | Deep Dives
Rep A books 22 meetings per quarter. Rep C books 8.
You see the gap, but you don’t know why Rep A wins.
Is it their script? Their calling times? Their research process? Their tonality?
The answer is already in your team. You just haven’t studied it.
Instead, Q4 hits and you throw solutions at symptoms:
“Let’s do more training!”
“Everyone needs to make 50 calls a day!”
“We need better scripts!”
You skip the diagnosis. You see low conversion and immediately prescribe more activity, more tools, new training.
Your Q4 plan is built on guesses, not data.
You focus on incremental gains instead of 2X levers.
You coach individuals but miss team-wide patterns.
You play it safe when you need big bets.
Today, I’m sharing the diagnostic framework I used with my teams to plan a high-impact Q4:
The Root Cause Outbound System
This system helps you:
Find your 2X levers
Diagnose WHY those levers exist (not just that they do)
Scale what your top performers already do
Fix the root cause, not the symptom
You’ll also get the Team Q4 Outbound Planner (Google Sheet).
Let’s dive in.
P.S. The two frameworks I shared today: Find your 2X Levers and BIPSY, I learned from KD (Kevin Dorsey), CRO at Finally.
The Root Cause Outbound System
Step 1: Get Your Q3 Data (Both Team AND Individual)
Before you can diagnose anything, you need data. Most leaders make one of two mistakes:
Mistake #1: They only look at team averages and miss individual performance issues.
“Our team averaged 4 meetings per week. Great!” But Rep A booked 8 while Rep C booked 1. Your average hides the problem.
Mistake #2: They only review reps in 1-on-1s and miss team-level patterns.
“Rep A struggles with cold calls.” But if you zoom out, the ENTIRE team has a 0.4% connect rate when industry average is 5%. That’s not a Rep A problem, that’s a calling time, data quality, or process problem.
You need both views: team patterns AND individual performance.
Gather Q3 data for each rep and put it in a table:
P.S. I shared the Q4 rep planner on Sunday. If you missed it, grab it here.
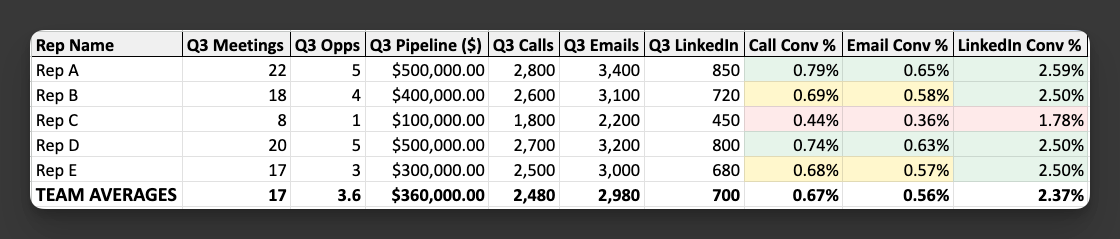
Now you can see both patterns:
Team-level: Call conversion is 0.67% (can you increase it to 1.2%?)
Individual: Rep A and D are the top reps, Rep C is struggling across all channels
This data sets up everything that follows.
Step 2: Find Your 2X Levers (Team AND Individual)
Too often, leaders try to fix everything at once. They see ten problems and attack all ten.
Don’t do this.
Instead, look for 2X levers, the places where you can realistically double performance in Q4.
There are two types:
Team-Level 2X Levers
Individual 2X Levers
Team-Level 2X Levers
These are metrics where your ENTIRE team underperforms vs. market benchmarks.
Compare your Q3 data to your industry standards (or your previous months, if you have historical data):
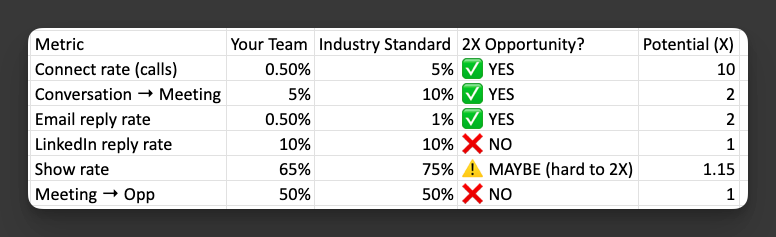
Pick the metric that can double or more.
In this example, the Connect Rate is the biggest opportunity (10x). That makes it the #1 priority for Q4.
Don’t waste Q4 on small tweaks to metrics that are already good.
Individual 2X Levers
These are gaps between your top performer and everyone else.
From your Q3 data:
Rep A: 0.79% call conversion, 22 meetings
Rep C: 0.44% call conversion, 8 meetings
The gap: If Rep C matched Rep A’s conversion rate (while maintaining same activity), they’d book 14 more meetings per quarter, almost doubling their performance.
The question: What is Rep A doing that Rep C isn’t?
Pick your top 3 2X levers for Q4.
Example based on our data:
Team:
Connect rate: 0.5% → 5%
Call: conversation into meeting: 5% → 10%
Team email reply rate: 0.5% → 1.0%
Individual:
Rep C’s activity volume and conversion (8 meetings → 16)
Now comes the critical part most leaders skip: diagnosis.
Step 3: Diagnose Using BIPSY (Don’t Skip This)
You’ve identified your 2X levers.
Now you need to understand WHY and What's broken in you system before fixingit.
KD uses the BIPSY framework to diagnose performance issues. This is his systematic approach to figuring out what’s actually wrong before prescribing solutions.
BIPSY stands for:
Behaviors
Individual Diagnosis
Process
Skill
You (the leader)
Because most leaders jump to solutions:
Low conversion? → “Do more calls!”
Missing quota? → “Attend this training!”
Poor pipeline? → “Use this new tool!”
But if you don’t know WHY the metric is low, your prescription probably won’t work.
Let’s walk through BIPSY for outbound and cold outreach:
1. BEHAVIORS: Are they DOING the right things?
Keep reading with a 7-day free trial
Subscribe to Outbound Kitchen to keep reading this post and get 7 days of free access to the full post archives.