

How to Divide Your Outbound Market Into Territories (7-Step Guide)
TAM → SAM → ICP → territories.

Welcome to a new 🔒 subscriber-only edition 🔒 of my weekly newsletter of Outbound Kitchen. Each week, I dive into reader questions about scaling outbound and making it your #1 growth engine. For more: Launching Outbound, and Scaling Outbound
I got this question from a GTM leader in December:
“I’m reading your newsletter. A topic I find very interesting (and I don’t find elsewhere) is how to divide the SAM into territories for each rep. Is this something you plan to cover soon?”
This is the question nobody answers well. Not TAM for investors. TAM/SAM/ICP for territory planning.
Here’s the step-by-step process:
P.S. Before we start: TAM, SAM, and ICP are not fixed. They evolve as your product and GTM evolve.
New integrations → SAM grows (more companies can buy)
New use cases → ICP expands (new segments become ideal)
New markets → TAM grows (new geographies, new verticals)
New GTM resources → SAM grows (add French speakers → France becomes addressable)
Snowflake started selling only to ad tech and gaming. That was their entire ICP, maybe <1,000 companies. Now they sell to dozens of industries.
This isn’t a one-time exercise. Revisit it quarterly as your product and team grow.
Why This Matters
When companies plan their sales team, they use TAM instead of ICP.
“We have 100,000 companies in our market.”
But if your ICP accounts convert at 25-30% and everything else converts at 1% or 0%, you don’t have 100,000 accounts. You have a much smaller number that will actually buy.
What happened at Chili Piper:
We overestimated the market. TAM looked huge—all B2B companies that book meetings.
Reality: ~11,000 accounts globally fit our ICP.
At 600 accounts per SDR (3-month contact cadence), that’s a maximum of 18 SDRs worldwide.
We over-hired. Gave reps “enough accounts.” But many had near-zero probability of converting. Productivity dropped. Eventually, we laid off part of the team.
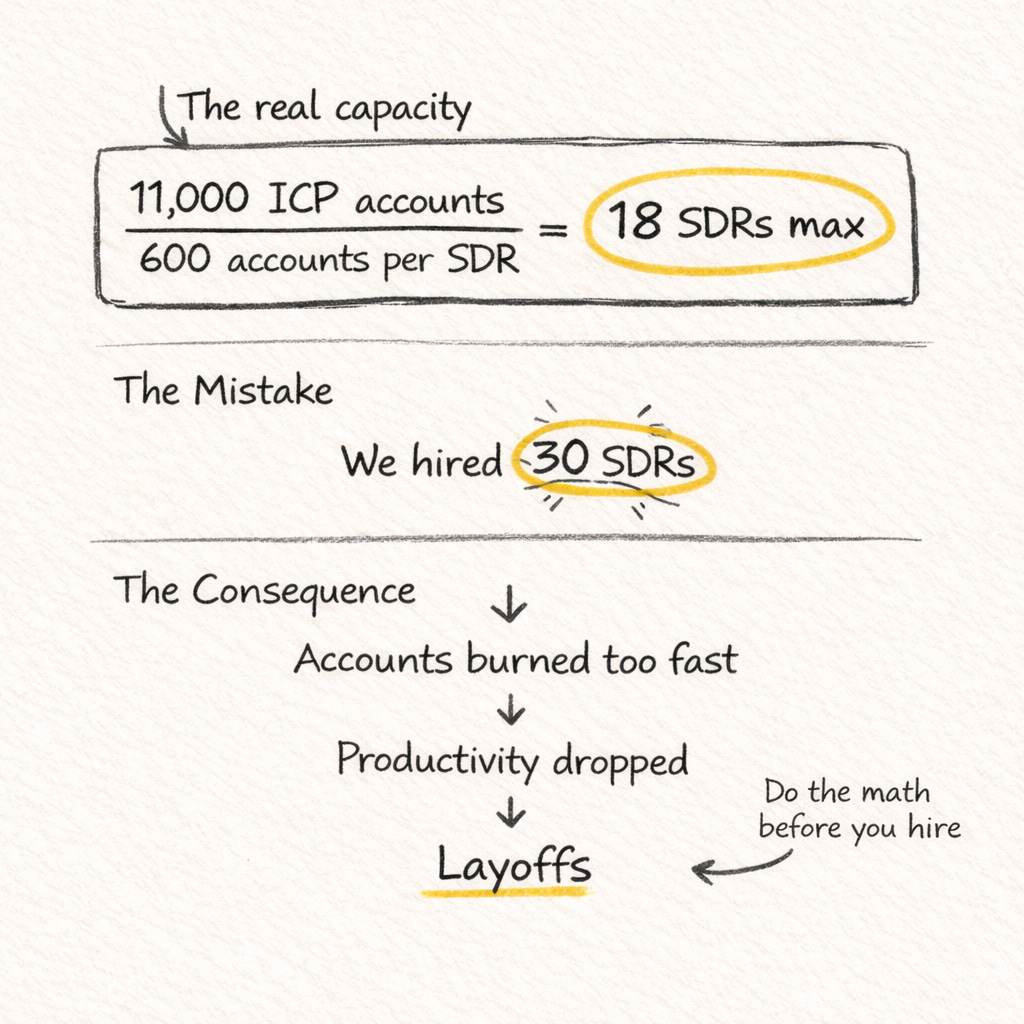
If we had done this exercise before hiring, we would have known the real capacity of our market.
The 7-Step Process
Define your TAM → Total market size
Filter to SAM → Companies that COULD buy
Discover your ICP → Companies you SHOULD target
Define Anti-ICP → Accounts to exclude
Score all accounts → Every account has a tier
Calculate capacity → How many reps your market supports
Divide by equal potential → Fair territories
Step 1: Define Your TAM (Total Addressable Market)
What: Count the total number of companies in your market.
Output: A number. The upper bound.
This is your starting point. The broadest definition of who could theoretically be a customer.
Examples:
Chili Piper: All B2B companies that book meetings with prospects
Rippling: All employers (any company with employees)
Snowflake: All companies that store and analyze data
Wiz: All companies using cloud infrastructure
Owner.com: All restaurants
TAM is mostly useful for investors and market sizing. It’s not useful for territory planning on its own.
Step 2: Filter to SAM (serviceable addressable market)
What: Filter TAM to companies that COULD buy based on product requirements.
Output: A smaller list of companies that fit your product.
SAM filters for:
Right integrations (CRM, tech stack)
Right geography
Right use case fit
Examples:
Chili Piper
TAM: All B2B companies booking meetings
SAM filter: Uses Salesforce or HubSpot
SAM: B2B companies on supported CRMs
Rippling
TAM: All employers
SAM filter: Supported geos, 50+ employees
SAM: Mid-market employers in US
Snowflake
TAM: All companies with data
SAM filter: Already on cloud (AWS/GCP/Azure)
SAM: Cloud-adopted companies
Wiz
TAM: All companies using cloud
SAM filter: Meaningful cloud footprint
SAM: Companies with real cloud infrastructure
Owner.com
TAM: All restaurants in US
SAM filter: 1-10 locations, offers delivery
SAM: Independent restaurants with delivery
Step 3: Discover Your ICP
What: Identify the common traits of your BEST customers.
Output: A list of detectable signals that predict success.
The Definition Most People Get Wrong
Mark Roberge:
“A great ICP is based on LTV, not lowest CAC, and that’s where a lot of people get that message wrong.”
Broken intuition #1: ICP = where our inbound demand is That’s not necessarily who you built the product for.
Broken intuition #2: ICP = where we have the highest close rates Only true if they stick around.
The correct frame: ICP = companies where you solve a significant problem.
When you solve a real problem, customers renew, expand, and refer. That shows up as high LTV. LTV is the signal—not the definition.
How to Discover Your ICP
Quality data: Customer conversations (Gong), interviews, CS calls → “Why did you buy? What problem did we solve?”
Quantity data: External sources at scale (Clay, LinkedIn) → Validate patterns across your customer base
ICP Must Be Detectable
If you can’t find the signal in external data, you can’t build target lists at scale.
Chili Piper ICP traits: SDR + AE model, high inbound volume, routing complexity Where to detect: LinkedIn (SDR headcount), job postings (demand gen, RevOps)
Rippling ICP traits: Distributed workforce, tool sprawl, HR/IT/Finance Ops exists Where to detect: LinkedIn (multi-location, ops roles), job postings
Snowflake ICP traits: Data team exists, building analytics/ML/AI Where to detect: LinkedIn (data engineer titles), job postings (dbt, Fivetran)
Wiz ICP traits: Security team exists, compliance pressure Where to detect: LinkedIn (security roles), job postings (SOC2, compliance)
Owner.com ICP traits: High delivery volume, DoorDash/UberEats dependency Where to detect: Google Maps, Yelp, Uber Eats/DoorDash presence
Step 4: Define Anti-ICP
What: Identify accounts with near-zero probability of converting.
Output: A “do not contact” list.
These are companies where CAC doesn’t make sense and same for LTV. If you give these accounts to reps, it doesn’t matter how good they are, these accounts will never close.
Examples:
Chili Piper:
Anti-ICP: Not using Salesforce/HubSpot CRM
Why: Product doesn’t integrate
Rippling Anti-ICP: <30 employees, contractor-heavy, locked into PEO Why: Too small, no pain, switching cost too high
Snowflake Anti-ICP: No data team, Excel-only, on-prem only Why: No buyer, no use case
Wiz Anti-ICP: No cloud footprint, no security team Why: No attack surface, no one to sell to
Owner.com Anti-ICP: No delivery, fine dining, large franchises Why: No margin pain, corporate procurement
At Chili Piper, if we had scored all accounts upfront, we would have seen some had 0-1% win rates. We paid reps to work accounts that were never going to convert.
Step 5: Score All Accounts
What: Assign a tier to every account based on ICP fit.
Output: A ranked list of all accounts.
Why Score?
Snowflake’s data:
Tier A accounts: 25% had an open opportunity
Tier B-E accounts: 5% had an open opportunity
Tier A converts 5x better
If you don’t score, you don’t know how much real potential you have.
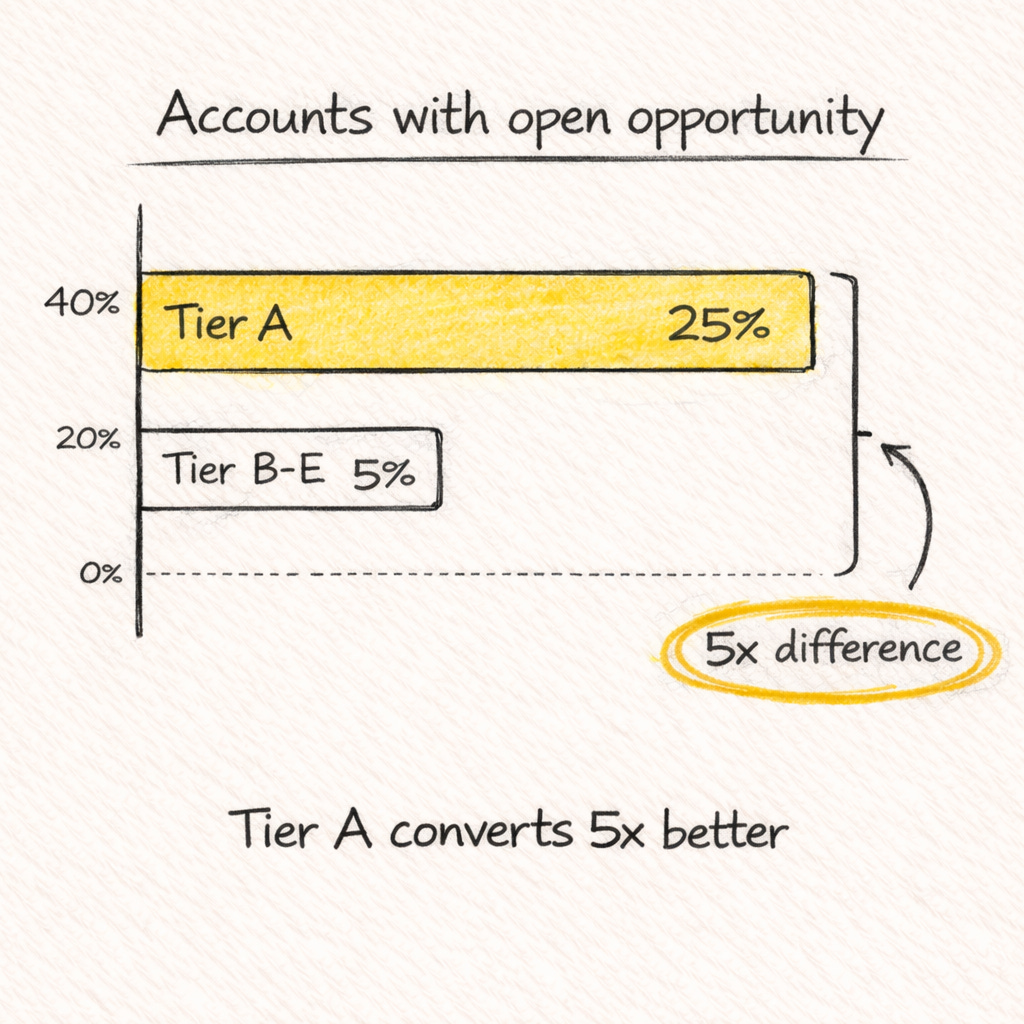
If you don’t score, you don’t know how much real potential you have. You might give reps accounts with 0% probability of closing.
How to Score
Use a simple 2-layer system:
Layer 1: Fit Score (0-100) — How well does this account match your best customers?
Layer 2: Value Prediction — What’s the potential deal size?
I covered the full scoring framework here
→ Quick Start: Build Account Scoring for Outbound
Step 6: Calculate Capacity
What: Figure out how many reps your market can support.
Output: A maximum headcount number.
The Formula
ICP Account Count ÷ Accounts per Rep = Max Reps
The Contact Frequency Rule
Accounts should only be contacted every 3 months. Touch them more often and reply rates tank.
This means:
If an SDR works 200 accounts/month
And accounts should only be contacted every 3 months
Each SDR needs 600 accounts minimum in their territory
The Chili Piper Example
ICP count: ~11,000 accounts globally
Contact cadence: Quarterly (3 months)
Accounts per SDR: 600
Max SDRs: 18 worldwide
If you hire 30 SDRs, you’re burning through accounts twice as fast. Reps run out of fresh accounts. Productivity drops.
The Key Insight: Optimize Before You Hire
Before adding headcount, ask: “Have we maxed out our current team’s productivity?”
Doubling productivity is cheaper and faster than doubling headcount.
I broke down the full capacity planning framework here
→ Here’s how to plan your 2026 outbound team (the right way)
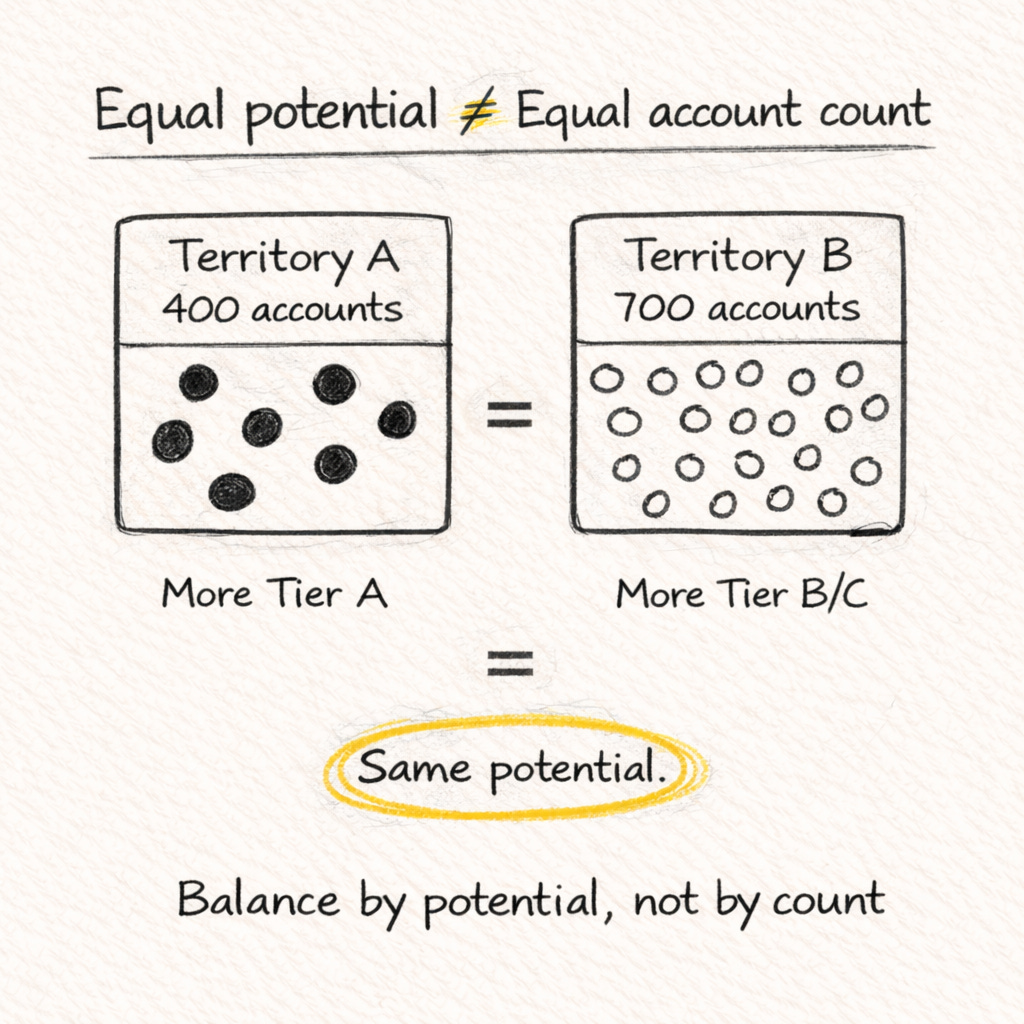
Step 7: Divide by Equal Potential
What: Create territories with equal potential, not equal account count.
Output: Fair territories where every rep has the same opportunity.
Start with Geography
Don’t over-complicate this. Divide by geography first—where are your ICP accounts?
If you have:
10,000 ICP accounts in the US
1,000 ICP accounts in Europe
You know your US team will be ~10x the size of your Europe team. That’s your starting point.
Vertical specialization (by industry) comes later, when you have the GTM team maturity. Companies like Snowflake can dedicate reps to financial services or healthcare. But that requires scale and enough accounts per vertical to justify it.
How to Divide
It depends on what data you have:
Early (no historical data) What you have: ICP definition but no win rate data How to divide: Equal ICP accounts per rep
Some traction What you have: Win rate data by tier How to divide: Equal Tier A accounts per rep, then balance the Tier B/C mix
Mature What you have: Deep historical data How to divide: Use conversion rates to balance expected pipeline per territory
Early stage: Make sure each rep has roughly equal ICP accounts.
With historical data: Make sure each rep has equal Tier A accounts (your highest converters), then balance the rest so no one is overloaded with low-probability accounts.
Quota Should Reflect Territory Maturity
If a rep is working a territory with proven data that it’s working, their quota should be higher than someone starting a new territory from scratch.
Equal potential ≠ equal quota. A mature territory with momentum should carry a higher target.
The Mechanics Depend on Your GTM
The exact process for territory assignment depends on your model—inside vs. field, segment splits, language requirements, existing customer relationships.
But the principle stays the same: balance by potential, not by count.
Where to Get the Data
Horizontal B2B SaaS: LinkedIn Sales Navigator + Clay → Headcount by function, company size
Restaurants: Datalane → Restaurant-specific data, delivery status
Ecommerce: Storeleads → Online stores, platforms
Benefits/Brokers: Benefitflow → Employer benefits data
Enrichment at scale: Clay → Combine sources, validate signals
Quick Reference: All 5 Companies
Chili Piper
TAM: B2B companies booking meetings
SAM: Uses Salesforce/HubSpot
ICP: SDR+AE, high inbound, routing complexity
Anti-ICP: No CRM integration
Data: LinkedIn, Clay, BuiltWith
Rippling
TAM: All employers
SAM: Supported geos, 50+
ICP: Tool sprawl, distributed, Ops roles
Anti-ICP: <30 employees, PEO locked
Data: LinkedIn
Snowflake
TAM: Companies with data
SAM: Cloud + analytics needs
ICP: Data team, building AI/ML
Anti-ICP: No data team, Excel-only
Data: BuiltWith, HG Insights
Wiz
TAM: Companies with cloud
SAM: Cloud + security pressure
ICP: Regulated, security team, compliance
Anti-ICP: No cloud, no security
Data: BuiltWith, HG Insights
Owner.com
TAM: All restaurants
SAM: 1-10 locations, delivery
ICP: High delivery, marketplace dependency
Anti-ICP: No delivery, fine dining
Data: Datalane, Google Maps
The Takeaway
Your TAM doesn’t build pipeline. Your ICP does.
The 7 steps:
Define TAM — Total market (for investors)
Filter to SAM — Companies that COULD buy (product fit)
Discover ICP — Companies you SHOULD target (LTV signals)
Define Anti-ICP — Accounts to exclude (0% probability)
Score all accounts — Tier every account by ICP fit
Calculate capacity — How many reps your market supports
Divide by equal potential — Start with geography, balance by ICP accounts or Tier A accounts
Which step is the hardest for you right now?
Defining ICP vs SAM
Finding the right data
Scoring accounts
Calculating capacity
Dividing territories fairly
Hit reply and tell me, I’ll cover the most requested topic in a future issue.
Elric
🔒 Paid Subscriber Bonus: The Territory Planning Toolkit”
Keep reading with a 7-day free trial
Subscribe to Outbound Kitchen to keep reading this post and get 7 days of free access to the full post archives.