

Advanced Scoring: Consumption + Buying Signals
Includes: 2 AI Prompts

Welcome to a new 🔒 subscriber-only edition 🔒 of my weekly newsletter of Outbound Kitchen. Each week, I dive into reader questions about scaling outbound and making it your #1 growth engine. For more: Launching Outbound, and Scaling Outbound
This is part 2 of a 2-part series on how to build your outbound scoring system.
The 3-Layer Scoring System That Drives Revenue
Scoring #2: Building Your Value Score (Part 2)
If you’re working on your value score and you’re using seat-based pricing, go check out part 1 first.
But if you’ve already built your first two scoring layers—and you’re not using a consumption-based model, go ahead and jump into the next section below to build your Buying Signals Score.
The Consumption-Based Scoring
Most GTM leaders using consumption-based pricing can't predict which accounts will become high-value customers. They're stuck playing revenue roulette with every outbound campaign.
Here's how to build a scoring system that identifies your highest-spending prospects before you even call them.
Traditional scoring works for seat-based SaaS where revenue equals seats times price. But consumption-based revenue depends on actual usage patterns, not headcount.
Look for activity indicators, not just company size
Track technical complexity signals that drive higher usage
Monitor growth-specific multipliers that 3x your baseline predictions
This approach helps you prioritize prospects who'll actually use your product heavily.
Snowflake's top customers often aren't the largest companies by employee count. They're mid-size firms with complex data needs, multiple analytics tools, and growing data science teams. The $50M company with 10 data engineers beats the $500M company with 2 analysts every time.
This pattern repeats across every consumption-based business model.
Stop chasing vanity metrics like company size. Start tracking usage predictors that correlate with actual spending.
Next, let's build your scoring.
Without usage prediction, you're essentially flying blind on planning. You can't prioritize effectively when every deal looks the same.
Calculate baseline consumption using technical team size and deployment complexity
Apply growth multipliers based on funding velocity, hiring patterns, and geographic expansion
Factor in operational signals like release frequency, system integrations, and compliance requirements
This framework helps you predict which prospects will become your highest-value customers.
Here's an example:
Baseline Consumption Indicators:
Finance team size: 1-3 people = $8K-$25K baseline, 4-10 people = $25K-$75K baseline, 10+ people = $75K+ baseline
Employee count: 50-200 employees = $15K baseline, 200-500 = $45K baseline, 500+ = $100K+ baseline
Transaction volume: Companies processing <500 monthly transactions vs >2,000 monthly transactions (3x spending difference)
Growth Signal Multipliers:
Recent funding: Series A in last 18 months = 1.8x (hiring spree creates expense chaos), Series B+ = 2.5x baseline
Headcount velocity: Companies adding >20 employees per quarter = 2.0x multiplier (new hires, equipment, travel)
Office expansion: Opening second office = 1.6x, third office = 2.2x (multi-location expense complexity)
Operational Complexity Factors:
Approval workflows: 3+ approval levels = 1.5x, department-specific budgets = 1.3x, project-based spending = 1.7x
Payment methods: Companies using >5 credit cards = 1.4x, corporate cards + reimbursements = 1.6x
Vendor count: >50 active vendors = 1.8x, >100 vendors = 2.3x (vendor management complexity)
Real Examples:
High-consumption prospect: 400-person SaaS company, Series B funding, 8-person finance team, 3 offices, 150+ vendors, department budgets = $180K predicted spend
Low-consumption prospect: 200-person consulting firm, bootstrap funding, 2-person finance team, 1 office, 25 vendors, simple approval = $25K predicted spend
A VP of Sales at a spend management platform couldn't distinguish between $15K and $150K prospects when targeting CFOs. After implementing this framework, they discovered that companies with 3+ office locations, 100+ vendors, and department-specific budgets consistently became their highest-value accounts. Their team stopped chasing bootstrapped companies with simple expense needs and focused on fast-growing, multi-location businesses with complex approval workflows.
Scoring transforms random outreach into targeted revenue generation.
The key is matching consumption drivers to observable external signals. Revenue follows usage, and usage follows predictable business patterns.
Here's how this plays out across different industries:
Industry-Specific Consumption Patterns
Every industry has unique consumption drivers that traditional scoring misses. Generic frameworks ignore the technical complexity that drives real usage.
Different business models create different consumption patterns that require specialized prediction approaches.
Data platforms scale with analytical complexity, not just data volume
Infrastructure tools grow with deployment frequency and technical sophistication
AI platforms expand with use case criticality and model training intensity
Understanding these patterns helps you identify prospects who'll actually drive revenue growth.
Data Platform Example:
A 500-person fintech company with 15 data engineers will outspend a 2,000-person retail company with 3 analysts. The fintech needs real-time fraud detection, regulatory reporting, and customer analytics. The retailer runs basic sales dashboards.
Infrastructure Example:
A 200-person SaaS company deploying code daily will consume 5x more than a 1,000-person manufacturing company deploying monthly. Deployment frequency drives infrastructure consumption, not employee count.
These patterns are predictable once you know what signals to track.
Industry context transforms generic company data into actionable consumption predictions. The same company size means completely different revenue potential across industries.
Now let's put this into action with a practical scoring system.
Your Consumption Scoring System
Building this system manually takes weeks of research and testing. Most teams never get past the planning stage because it feels overwhelming.
Start with baseline consumption for your industry and company size brackets
Add multiplier factors for technical complexity and growth indicators
Validate predictions against your existing customer consumption data
This systematic approach gives you predictable deal sizing within 30 days.
Stop treating every prospect like they'll hit your average deal size.
Consumption-based businesses need consumption-based scoring.
If you’re a paid subscriber, I dropped a detailed AI prompt at the end of the newsletter to help you build your consumption scoring system faster.
Your basic 2-layer system is working. Teams are using it, response rates are up, and you've proven that scoring drives results.
Now you're ready for the 3rd-layer scoring.
Layer 3: Buying Signals Scoring (Intent & Timing)
You already have your Fit and Value scores working.
With outbound, you control who you contact, the right account, the right person, and what to say. But unfortunately, we don't control timing, that's why we need this 3rd scoring so we focus on the accounts that are likely to buy right now.
If you're starting, You stare at 50+ possible buying signals and have no idea which ones matter.
If you're tracking already: Your team ignores alerts because you track everything and convert nothing.
Both problems kill efficiency. Analysis paralysis for beginners. Alert fatigue for veterans.
This guide gives you the exact signals that convert for you, how to score them, and how to automate everything
Why score your signals?
Because not all signals are worth tracking, or sending to your team.
You want to focus only on the ones that actually connect to revenue. If you start flooding reps with every little thing, like someone just visiting your homepage… they'll start ignoring all of it. That's how you get alert fatigue.
Here's another key thing: your reps shouldn't even see the score. The score should live quietly in the background, just helping decide which signals actually get surfaced.
Because reps don't act on numbers, they act on context.
So what they get should be simple:
What happened (the event)
Why it matters (the impact)
What to do next (the action)
Think about how Snowflake built their Action Boards. It's not about dumping more data on reps, it's about helping them focus on what actually moves the needle.
P.S. In this guide, I’m talking just about tracking and scoring the signals. How you act on them, what to say, what not to say, I’ll break that down in another newsletter.
The Revenue-First Signal Framework
Most teams build signal scoring backwards, starting with available data instead of revenue outcomes. This creates elegant systems that don't drive sales.
Here's why: Correlation doesn't equal causation, especially with buying signals.
Build it revenue-first instead:
Start with closed-won analysis - Identify common signals in your best deals, and what your team is already using
Validate signal timing windows - Find optimal freshness periods for each signal type
Stack-rank by revenue impact - Score signals based on actual pipeline contribution
The result: Every tracked signal has proven revenue correlation.
How to Identify Your High-Converting Signals
GTM leaders often guess which signals matter most based on intuition rather than data. This leads to tracking vanity metrics that feel important but don't drive revenue.
Here's your signal discovery process:
Run closed-deal signal analysis - Map every signal present 30 days before close
Calculate signal conversion rates - Track signal-to-opportunity and signal-to-close rates
Test signal combinations - Find which signal stacks predict highest close rates
The payoff: You discover hidden revenue patterns in your buyer journey.
Signal Library
(Relative weight: H/M/L - each business context is different)
Again, this list is non-exhaustive, each business context is different
First-Party (your strongest predictors)
These are the strongest predictors because they show direct engagement with your brand.
Website intel (Relative Weight: M-H)
Demo request
Pricing inquiry
Pricing page deep engagement (5+ minutes)
Case study downloads in their industry
"Product vs Competitor" page visits
Solution-specific content consumption:
Return visits from same account (3+ times)
Multiple unique visitors from same company
ROI calculator usage
Product usage (Relative Weight: M-H)
Free trial started
Active trial usage (daily logins)
Feature adoption in trial (3+ features)
Integration attempts during trial
Crossing usage limits/overage
API exploration or developer activity
Email/content (L-M)
50 %+ open rate, multi-stakeholder opens, internal sharing, webinar attendee, re-engagement after 6 m
2.2 Second-Party (ecosystem)
Partner (M)
Shared customers or mutual prospects
Partner referrals or warm introductions
Technology partner integration signals
Mention in partner case studies
Joint customer success stories
Community (M)
LinkedIn engagement with your employees
Active participation in your community
Questions asked by a prospect in a community
LinkedIn engagement with your employees
Active participation in your community
2.3 Third-Party (external)
People moves (H)
Champion/Economic buyer/contact job changes to prospect companies ( with heavy usage, habitual
Job postings for roles that use your solution
New leadership in target functions (VP/C-suite)
Tech & tools (M–H)
Technology stack changes (complementary tools)
Competitive tool removal/changes
Competitor Renewal date
Growth & money (M)
Recent funding rounds (0-6 months)
Rapid hiring surge (30%+ team growth)
New market or geographic expansion
Product launch announcements
IPO preparation or going public
Intent & research (M)
G2 category research activity
Bombora keyword intent in your space
Competitor evaluation and comparison
RFP activity in your solution category
Industry analyst engagement
Trade publication mentions of transformation
Building Your Signal Scoring System
Most scoring systems assign arbitrary point values without considering signal decay or interaction effects. This creates false confidence in stale or isolated signals.
The trap: Static scoring doesn't reflect how buyer intent changes over time.
Build dynamic scoring instead:
Apply freshness decay curves - Weight recent signals higher than old ones
Create signal multipliers - Boost scores when multiple relevant signals stack
Set threshold triggers - Define score levels that trigger specific actions
Your scoring reflects real-time buyer intent accurately.
Examples for decay curves:
Product trial: 30 days
Job change: 90 days
Funding: 180 days
Job posting: 60 days
Signal multipliers:
2-plus first-party signals
Cross-channel touch (web + email + event)
Multi-stakeholder + intent spike
Champion exits + new ATL hire
Seasonal timing (Q4 budget, renewal quarter)
Smart scoring considers time, context, and combinations. This creates signal intelligence instead of signal noise.
Finally, let's automate your workflows around these scores.
Setting Up Automated Workflows
Most teams manually review signal alerts, creating delays and inconsistent follow-up. By the time someone acts, buyer intent often cools.
Manual signal review kills the timing advantage that makes signals valuable.
Automate your signal response:
Create score-based routing rules - High scores trigger immediate rep assignment
Build contextual alert templates - Include why the signal matters, suggested actions, and when it matters, add to the relevant sequence
Set up escalation workflows - Route ultra-high scores to senior reps automatically
Front-End Experience (what the rep sees)
Ideal Slack card / CRM task example:
🔥  New VP of Operations hired at ACME (5 days ago)

Why this matters: 63 % of our closed-won deals were sourced <30 days after an Ops VP hire.

Next step: Call their direct line today and re-send the “30-day Operations Modernisation” email.

↳ View full account timeline
↳  Mark as Not helpful
Tools to start building your buying signal scoring
Capture signals: Clay, Common Room, Pocus, Usergems, Champify
Process signals: Your CRM, data warehouse, Marketing Automation Platform
The difference between winning and losing with signal scoring isn't the sophistication of your system, it's whether you track signals that actually convert to revenue.
2 AI Prompts for Paid Subscribers
Here are two prompts to help you move faster:
One to build your v1 consumption scoring system
One to create your v1 signal scoring system from scratch
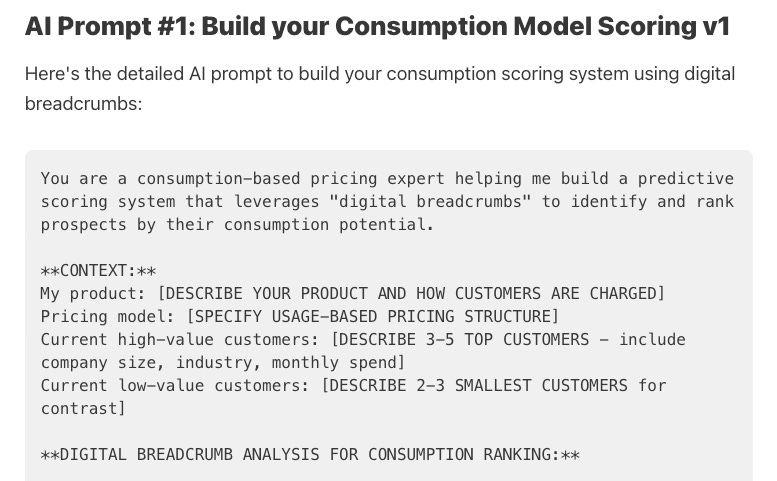
AI Prompt #1: build your v1 consumption scoring system
Here's the detailed AI prompt to build your consumption scoring system using digital breadcrumbs:
Keep reading with a 7-day free trial
Subscribe to Outbound Kitchen to keep reading this post and get 7 days of free access to the full post archives.