

[Starter Kit] Step 5: When to Scale Your Outbound Team
Including: 1 Spreadsheet: Headcount & Capacity Planning V1


Alright, quick recap before we jump in:
Step 1: You nailed your ICP, broke it down into mini-segments, and mapped out real personas. (If you missed that, go read it first.)
Step 2: You wrote problem-first messages that don’t sound like every other cold email. (Yep, there’s a link for that too.)
Step 4: You made your first hires without blindly copying playbooks from companies nothing like yours.
Now we’re on to Step 5: When should you actually scale your outbound team?
Your outbound engine needs to be proven before you add fuel.
Premature sales team scaling is silently killing startups. You've checked all the boxes, ICP defined, personas built, messaging crafted, tech stack implemented, yet your CAC keeps climbing while pipeline remains unpredictable. Each new sales hire feels like throwing more fuel on an engine that's spewing smoke instead of generating power.
When you scale your outbound team before proving your model works, you're essentially lighting money on fire.
The painful truth: Most founders and GTM leaders scale outbound based on hope, not data
Your expensive AEs are spending their days prospecting instead of closing deals
They hire AEs before having a consistent, repeatable way to fill their pipelines
They ignore the critical ramp time for new sales hires, creating a dangerous cash burn rate
They lack clear metrics to determine whether their outbound model is actually working
They scale the sales team reactively after missing targets instead of proactively based on validated data
There's a better way to scale without the chaos and cash burn. This framework transforms your outbound function from a costly experiment into a predictable revenue engine.
"Headcount is gasoline. If the engine isn't tuned, all you do is set money on fire." — The unspoken law of every great CRO.
Here's how:
Verify the foundation is solid
Measure your readiness with key metrics
Calculate your capacity needs with revenue math
Determine your hiring plan with a phased approach
Monitor and adjust using your outbound speedometer
Bonus for paid members: Spreadsheet: Scaling Outbound: Headcount & Capacity Planning V1
Step 1: Verify Your Foundation
No amount of headcount solves a broken system.
Before adding a single SDR, confirm you've established both product-market fit (consistent retention rates, predictable usage patterns, referenceable customers) and go-to-market fit (defined ICP, resonant messaging, at least one reliable segment). Think of your outbound motion as an engine that needs tuning before acceleration.
Proof point: Companies that scale before establishing these fundamentals experience 3.2x higher customer acquisition costs and 58% lower sales team productivity (SaaS Capital, 2023).
Without this foundation, each new hire simply amplifies existing problems, burning cash without proportional results.
Let's keep going with my ElevenLabs example:
Product-Market Fit Assessment:
Customer retention rate: 92% (above industry benchmark of 85%)
Average user creates 50+ minutes of AI voice content monthly
47 referenceable customers willing to speak with prospects
Go-to-Market Fit Assessment:
ICP v1 (and still evolving):
Indie & mid-tier game studios (50-500 devs): VO iterations delay releases; localization adds six-figure costs.
PLG SaaS scaling to EMEA/APAC: Product videos, onboarding tours & IVR only in English; non-English traffic ≥30 % but no localized audio.
E-learning/LMS platforms (≥500 courses): Voice-over costs crush margins; need multiple accents & quick updates.
Primary persona:
Content Production Directors (budget authority + technical understanding),
B2B Content Marketing Leaders
We can book constantly within those segments
We have good input and conversion rates: contact data connect rate 5%+,
Documentation: playbook v1 with call scripts, objection handling, and competitive battlecards
Decision: we have a solid foundation to build upon. Their consistent user engagement and high retention rates show Product-Market Fit, while their defined ICP and effective sequences demonstrate Go-to-Market Fit.
Step 2: Your North Star Metric Reveals When You're Ready
Sales Qualified Opportunities (SQO) created per SDR per month predicts scaling outbound success.
This single metric reveals whether your outbound motion is consistent enough to multiply. Track it for a minimum of 3 consecutive months, looking for stability (±15% month-over-month). Supporting metrics like email reply rates (±5%), meeting acceptance rates (±10%), and meeting-to-opportunity conversion rates (±15%) should also demonstrate consistency.
Ready to scale when: This number is consistent (±15% month-over-month) for at least 3 consecutive months.
For example:

Supporting metrics that influence your North Star (examples):
Email sequence reply rates: Consistent within ±5%
Meeting acceptance rates: Consistent within ±10%
Show rates: >80%
Meeting-to-opportunity conversion: Consistent within ±15%
If you can't predict next month's metrics within these ranges, you don't have a repeatable process yet. Scaling will only compound inconsistency.
ElevenLabs Example:
North Star Metric Tracking (Early-Stage Team):

Supporting Metrics (October):
Email reply rate: 6% (±0.3% over last 3 months)
Meeting acceptance rate: 18% (±1% over last 3 months)
Show rate: 85% (±3% over last 3 months)
Meeting-to-opportunity conversion: 60% (±3% over last 3 months)
Decision:
After 7 months of experimentation and inconsistent results (January-July), we achieved 3 consecutive months of stable opportunity creation at 10-12 opportunities per SDR. This realistic progression shows how an early-stage team typically moves through experimentation to consistency. Now we're ready to calculate their capacity needs.
Step 3: Calculate Your Capacity Needs
Now that your metrics show you're ready to scale, you need to determine exactly how many people to hire based on revenue targets.
The Alignment Principle
Think of outbound (demand generation) and sales capacity like gears that must turn together:
Outbound Capacity: How many SQO your SDRs can create fully productive in a month
Sales Capacity: How many SQO/Stage 2 Opportunities your AEs can handle per month
This prevents the common mistake of having AEs without enough opportunities that can't be worked effectively.
Follow this calculation approach:
Use this opportunity-based calculation approach:
1 - Calculate needed AEs
New AEs Needed = Bookings Gap ÷ AE Annual Quota2 - Calculate total opportunities needed
Total Opportunities Needed = Number of AEs × Opportunities needed per AE to hit quota3 - Calculate SDRs needed based:
SDRs Needed = Total Opportunities Needed ÷ Opportunities per SDR per monthSimple right?
Well, not exactly, that's where founders and GTM leaders get this wrong because they start with the annual example.
Now let's go back to our example:
ElevenLabs Example:
One of the most common mistakes when scaling outbound?
You start with a goal like: “Let’s add $5M in net new ARR,” then jump straight to: “Cool, let’s hire 10 SDRs and 5 AEs.”
And that’s usually how teams end up hiring too fast… and still missing targets.
In this example, we’re doing the opposite. We ask:
With 2 SDRs, how much pipeline can we actually create?
If we add 2 more, what changes?
What’s the real capacity of our AEs to handle that pipeline?
Current State:
Current ARR: $2.5M
Team: 2 SDRs, 2 AEs (fully ramped)
Average deal size: $25,000
Win rate: 10% (from SQO to closed deal)
Annual quota per AE: $600k ARR ($50k monthly)
Each AE needs 20 SQOs per month to hit quota (with 10% win rate)
Each AE can handle up to 20 SQOs per month (full capacity)
Each SDR is creating 12 SQOs per month
The Time Lag Reality
At an early stage, time lags are often not included and must be factored into your scaling plan:
SDR ramp time: 3-4 months until full productivity
AE ramp time: 5-6 months until full productivity
Sales cycle length: 4 months from opportunity to close
This means the full timeline from hiring an SDR to realizing revenue can be 7-8 months (SDR ramp + sales cycle), and new AEs won't be fully productive for nearly half a year.
Realistic Growth Constraints (at this stage):
Can effectively hire and ramp 1 new AEs at a time (max)
Can effectively hire and ramp 2 new SDRs initially
Building a Month-by-Month Plan for Next Year:

In this example, the 2 SDRs we hired in Month 1 are ramping slower than the ones we hire later in Month 8.
Why? Because by then, we’ve improved the onboarding, so the newer reps ramp faster.
We also wait to hire SDR 5 and 6 until Month 8 because we want to be sure SDR 3 and 4 are just as consistent and predictable as SDR 1 and 2 before scaling further.
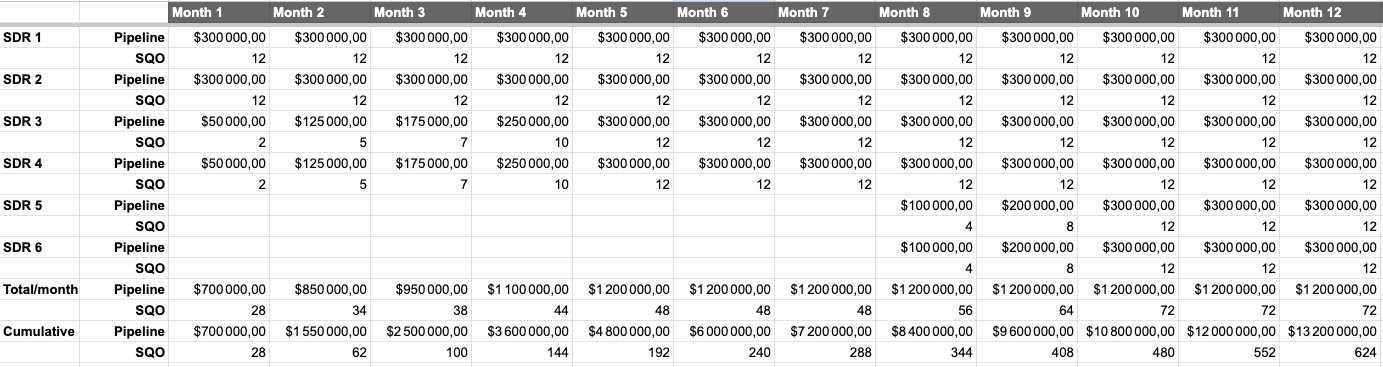
Because of the lag in sales cycles, you’ll notice SDR 3 and SDR 4 (hired in month 1) didn’t source their first deal until month 7.
Same thing for SDR 5 and SDR 6 (hired in month 8), their first deals came in month 13.
That’s why it’s so important to plan with enough runway.

If you want the spreadsheet to use it for your own setup, I added it at the end of this newsletter. You can unlock it by upgrading or starting your free trial.
This example shows that even with the additional hires, there will be an opportunity gap that must be addressed through:
Improving SDR productivity (from 12 to 15+ SQOs per month)
Improving SDR onboarding to cut ramp
Supplementing with other lead sources
Hiring additional SDRs if the first batch proves successful
Rippling Sales Math Example:
In Rippling’s early days, each AE needed 35 accepted demos (S2s) per month to hit their targets. As the business grew, they required fewer demos to meet the same goals because of two key factors:
Higher Deal Values (ACV): Each deal was worth more, so fewer deals were needed to reach revenue targets.
Improved Win Rates: The team got better at closing deals, so each demo was more likely to turn into revenue.
Understanding the Sales Stages (S1 and S2)
Stage 1 (S1): Scheduled Demo — the first meeting with a prospect.
Stage 2 (S2): Sales Accepted — when a prospect moves to the next stage of the sales process.
Step 4: Phase Your Hiring to Prevent Overspending
Implement a measured approach rather than hiring all needed headcount at once.
Structure your growth in four distinct phases with data-driven evaluation points:
Phase 1: Initial Investment (January)
Add 1 AE and 2 SDRs (bringing total to 3 AEs and 4 SDRs)
Assign a team lead from existing SDRs for coaching new hires
Create detailed onboarding plans with 30/60/90 day expectations
Phase 2: First Evaluation (April)
Are SDRs progressing along expected ramp curve?
Are AEs at full capacity
Make data-driven decision:
YES: Hire 2 more SDRs in Q2
NO: Delay additional hiring, diagnose issues
Phase 3: Second Evaluation (July)
Are Q1 hires now at full productivity?
Are metrics stable across the entire team?
Is sales capacity and outbound capacity adequate?
Make data-driven decision:
YES: Consider 1-2 more SDRs
NO: Focus on optimization
Phase 4: Planning Cycle (October)
Evaluate full-year performance
Calculate team capacity for next year
Build hiring plan based on actual productivity, not targets
This time-aware approach respects the reality of ramp periods and sales cycles, preventing the common mistake of overinvesting too early.
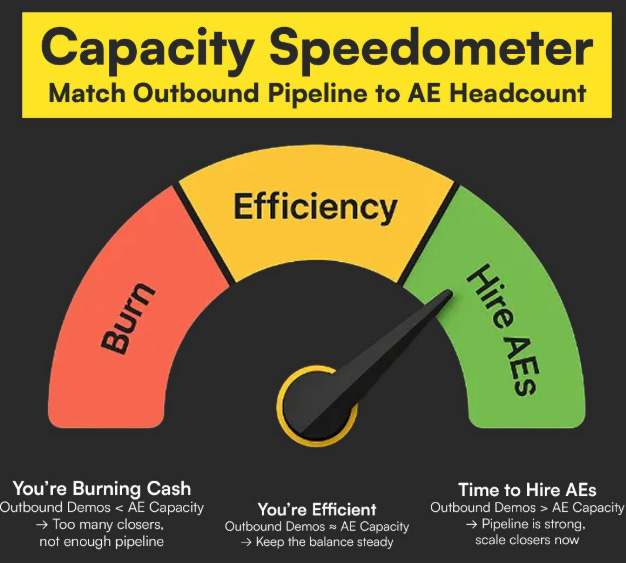
Step 5: Create Your Outbound Speedometer to Monitor Scaling Health
Build a weekly dashboard that serves as your "scaling speedometer" to detect issues early. Your dashboard should monitor both outbound production capacity and sales capacity, with special attention to ramp progress:
Outbound Capacity Metrics
Opportunities Created Per SDR Per Month
Pipeline Created Per SDR Per Month: SQOs × ACV
Ramp Progress vs. Target: Expected vs. actual production by month in role
Meeting Acceptance Rates: Early warning of messaging or targeting issues
Show Rates: Indicates meeting quality and scheduling processes
Meeting-to-Opportunity Conversion: Signals alignment with sales criteria
Sales Capacity Metrics
Pipeline Coverage: Total pipeline / quota
Ramp Progress vs. Target: Expected vs. actual pipeline and revenue by month in role
Win Rate: Percentage of SQOs that become closed won deals
Sales Cycle Length: Time from SQO to close (monitor for expansion)
Pipeline Velocity: Value of pipeline moving forward each week
Deal Slippage Rate: Percentage of deals missing forecasted close dates
Decision Framework for Speed Adjustments

Regularly compare these metrics against expected values to determine when to accelerate or pause hiring.
One Question Separates Successful Outbound Teams from Cash-Burning Failures
Most teams ask: "How quickly can we hire?" when they should ask: "How effectively can we grow while maintaining performance?"
The bottom-up approach to scaling outbound isn't about speed, it's about building a sustainable growth engine that delivers predictable revenue without the chaos of premature scaling. By respecting time constraints, building a quarter-by-quarter plan, using phase gates for hiring decisions, and monitoring ramp progress separately, you establish the foundation for efficient growth.
Remember these three critical truths:
Time lags are your biggest constraint, not headcount availability
New hires will take 6-9 months to show full impact on revenue
Consistency in your North Star metric precedes any scaling decision
Bonus: Spreadsheet Scale Outbound
Get the spreadsheet Scale Outbound: Headcount & Capacity Planning here
Keep reading with a 7-day free trial
Subscribe to Outbound Kitchen to keep reading this post and get 7 days of free access to the full post archives.