

How to prove outbound is working (to your CEO)
The exec dashboard that answers the right questions

👋 Hey chef, Elric here! Welcome to this week’s free edition of Outbound Kitchen. Each week I dive into reader questions about creating outbound systems for sustainable growth. Thinking about going paid? Here’s what you’ll unlock right away:
Instant access to 40+ paid newsletters, including:
My Outbound Chef Kit: 130+ resources (20+ email templates, cold call scripts, AI prompts, top tools, and more). Value: $1,000+
And the best part? You can try it free for 7 days. Cancel anytime.
But I think you’ll love it!
👉 Start your free trial today.
A GTM leader asked me about this recently:
“CEOs don’t understand true lead sources and the number of touches needed to convert a lead. They need visibility into SDR/BDR work.”
Most companies have one revenue dashboard. Outbound, demo requests, PLG, partners, all mixed together.
Leadership sees “pipeline” and “revenue.” But they have no visibility into what outbound specifically contributes.
This creates problems:
You can’t prove outbound is working, even when it is. Outbound gets compared to inbound unfairly (more on this later). Budget conversations turn into “outbound isn’t producing.” And when cuts come, outbound goes first.
Most executives don’t understand what outbound actually takes. They see inbound demos converting at 40% and outbound converting at 20%, and they ask: “Why is outbound underperforming?”
It’s not underperforming. They just don’t have the context.
The solution: a dedicated outbound section in your exec reporting. Organized by pipeline source. One that shows what outbound contributes, what it takes, and whether it’s working.
Here’s how to build it.
P.S. This is for execs and board meetings, so I’m not covering what front-line managers or reps should track and use.
PART 1: Why Outbound Needs Its Own View
1.1 The Visibility Problem
Outbound is buried.
When everything lives in one revenue dashboard, you can’t see what outbound specifically contributes. You can’t compare outbound to outbound standards - only to inbound, which isn’t fair. And budget decisions get made without understanding the motion.
The first question your exec dashboard needs to answer:
“What percentage of our pipeline - and revenue - comes from outbound?”
If you can’t answer this, you don’t have visibility.
Here’s what separation looks like:
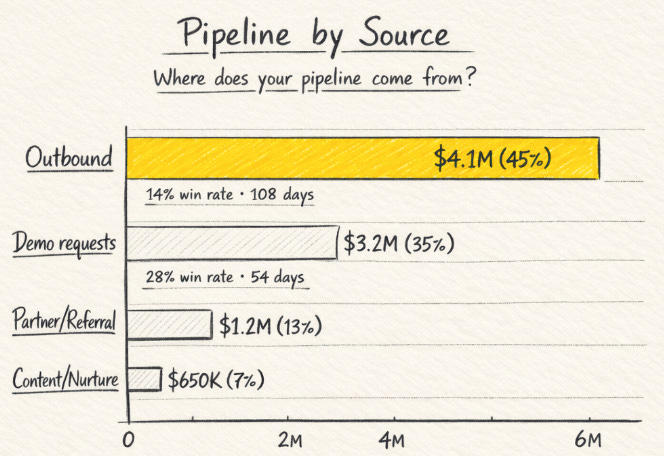
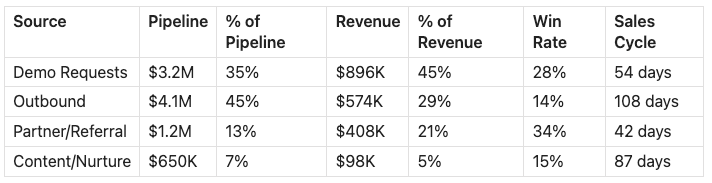
Now you can see what each motion contributes - pipeline AND revenue - and have informed conversations about resources.
1.2 The Education Problem - CEOs Don’t Understand the Work
That’s the real problem. They see the numbers but don’t understand what it takes to produce them.
Track your own productivity metrics:
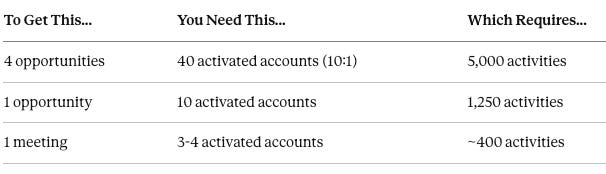
Activities per account to activate
Activities per meeting booked
Activated accounts per opportunity
These aren't industry benchmarks to hit — they're YOUR baselines to track and improve. One company might need 80 activities per meeting, another might need 1000. The number matters less than knowing your number and improving it over time.
Once you know your numbers, the CEO understands:
Outbound is not “send some emails and get meetings”
There’s a predictable amount of work behind each conversion
More pipeline = more resources (or better efficiency)
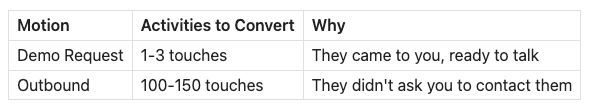
How outbound differs from inbound:
The 2x Rule for Setting Expectations
From my observation working at different companies - a simple mental model for executives:
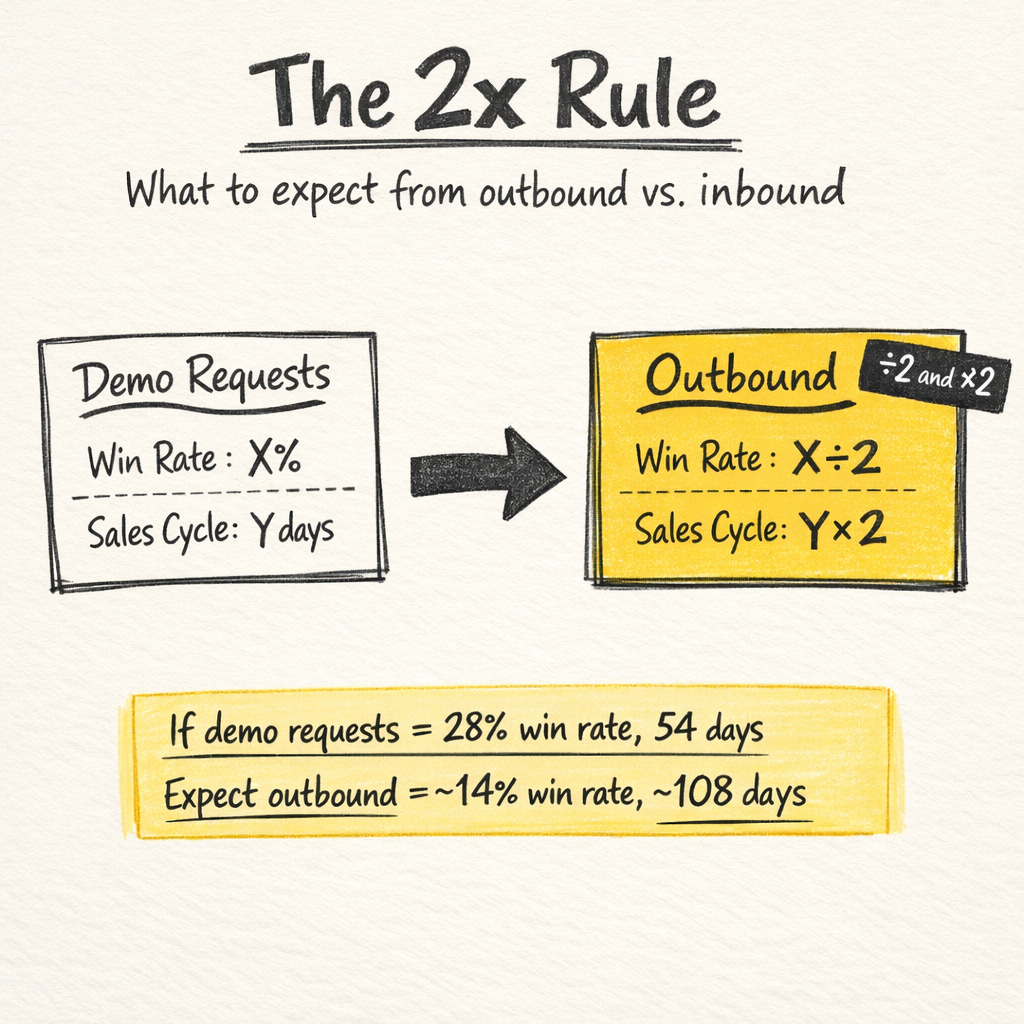
If your inbound demo win rate is 40%, expect outbound at ~20%. If your inbound sales cycle is 60 days, expect outbound at ~120 days.
This is backed by data. HockeyStack analyzed 50+ B2B SaaS companies and found:
Outbound conversion: 17% vs Inbound: 28%
Outbound sales cycle: 82 days vs Inbound: 54 days
Give executives this mental model BEFORE they see your outbound numbers. It stops the “why is outbound underperforming?” question before it starts.
Part 2: The Framework: How to Structure Outbound Reporting
2.1 The Account Funnel
For mid-market and enterprise, use accounts, not leads.
Why? You’re working multiple contacts per account. Lead-based reporting doesn’t capture the full picture. Account-based shows the true conversion from target to won.
(Note: For SMB/high-volume, lead-based may still work.)
The Account Funnel Stages:
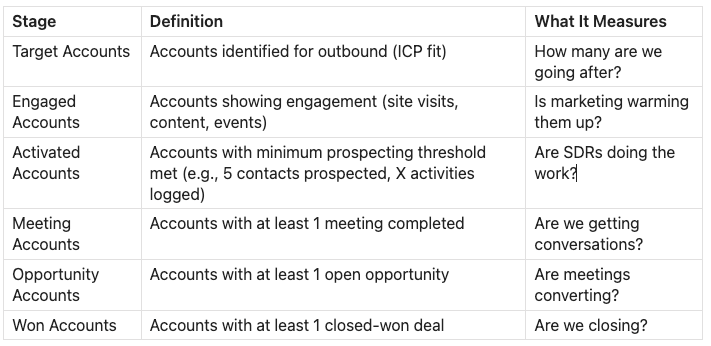
The key distinction:
“Engaged” means they showed intent (passive).
“Activated” means we did the work (active). An account isn’t activated until your SDRs have hit the minimum prospecting threshold, not just one touch.
The key question this funnel answers for execs:
“If I add 100 accounts to our outbound funnel, how much pipeline will I create?”
Build YOUR conversion rate from your own data over time.
2.2 Adding Quality to the Funnel
Counting isn’t enough. “10 meetings booked” doesn’t tell you if they’re the RIGHT meetings.
Add two quality dimensions:
Account Tier (ICP fit):
Tier 1: Perfect fit, highest priority
Tier 2: Good fit
Tier 3: Acceptable fit
Contact Seniority (Above/Below the line):
Above the line: VP+, decision-makers
Below the line: Managers, individual contributors
Example dashboard view:
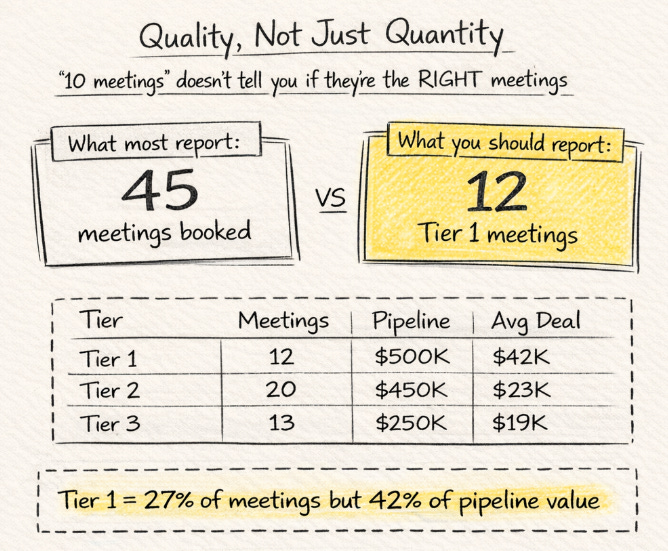
“12 meetings with Tier 1 accounts” tells a very different story than “45 meetings.”
2.3 Standardize Your Definitions
Without standardized definitions, you’ll spend board meetings arguing about what the numbers mean instead of what to do about them.
Define these before you build:
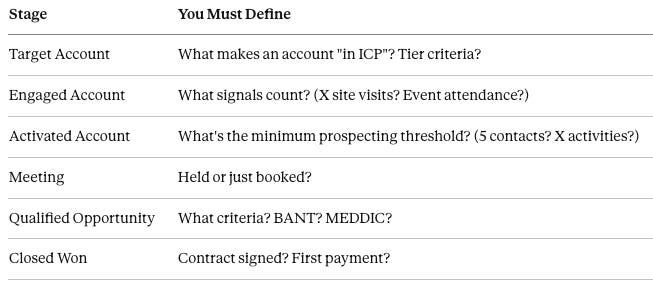
Winning by Design puts it well: “Measuring related sales metrics against different points creates confusion. You must measure against the same point.”
If you’re comparing outbound to inbound, compare at the same stage.
Action: Get alignment on definitions. Write them down. Share with the team. Do this BEFORE building any dashboard.
Part 3: The Dashboard - What to Actually Show Execs
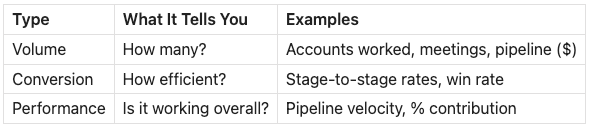
3.1 The Metrics That Matter
Winning by Design breaks metrics into three types:
3.2 The Exec Outbound Dashboard
Execs need to answer 4 questions:
Is outbound contributing? (% of pipeline AND revenue)
Is it efficient? (Conversion rates, cost per opp, CAC)
Is it improving? (Velocity trend)
Are we on track? (Progress vs targets)
What to show:
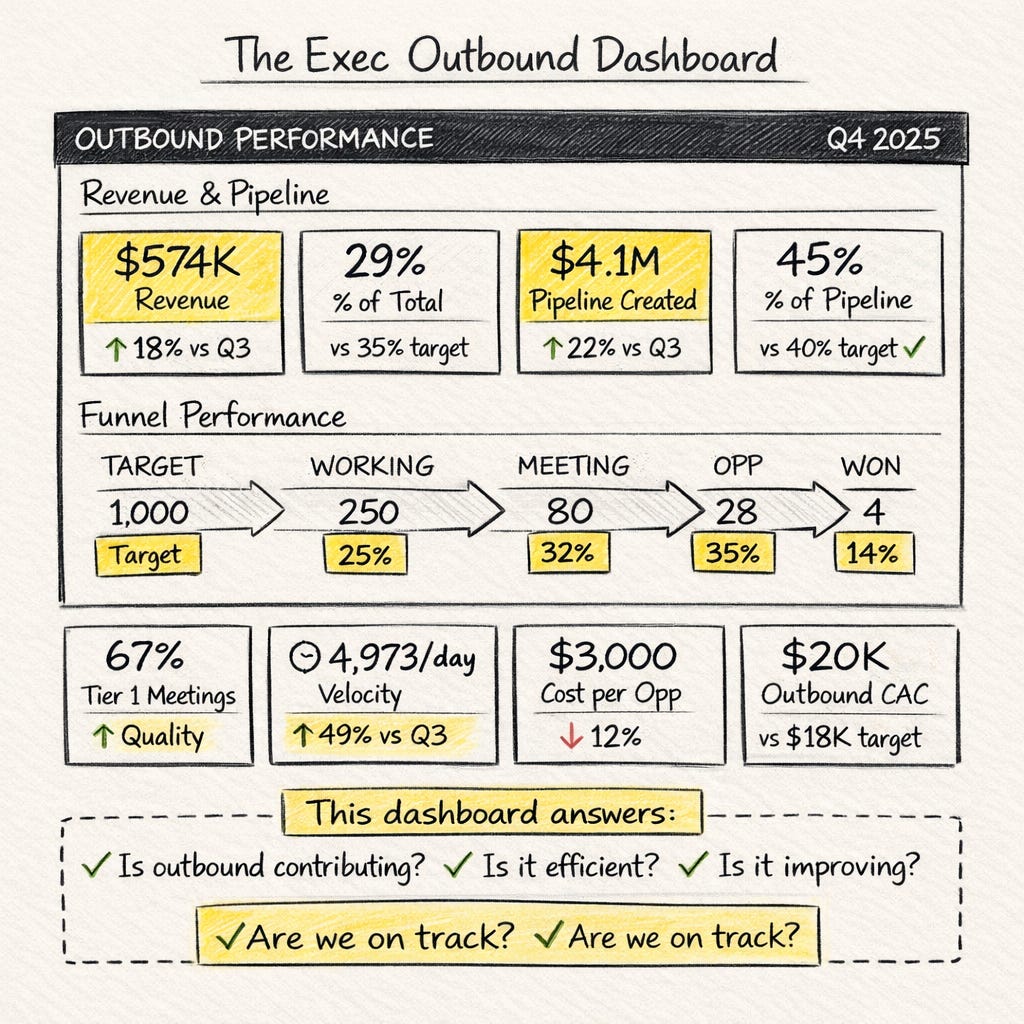
A) Revenue & Pipeline Contribution (The headline)
Revenue from outbound-sourced deals ($) + % of total revenue
Pipeline generated from outbound ($) + % of total pipeline
Comparison to other sources
Progress vs target
B) Funnel Performance
Accounts at each stage
Conversion rates between stages
Progress vs target for key stages (meetings, qualified opps)
Trend over 4-5 periods
C) Quality Indicators
Meetings/Pipeline by account tier
Decision-maker involvement rate (% above the line)
Win rate on outbound-sourced deals
Average deal size
D) Velocity
Pipeline velocity (current vs previous period)
Trend over time
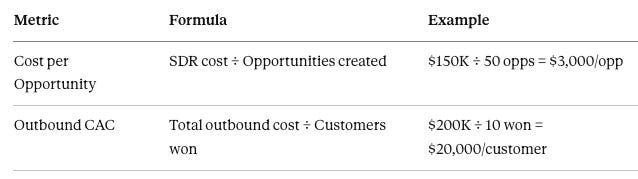
E) Productivity & Cost Metrics
Activity efficiency:
Activities per meeting booked
Activities per opportunity created
Cost efficiency:
3.2 What NOT to Show Execs
Keep these for manager dashboards:
Activity counts (calls, emails, LinkedIn touches)
Individual rep performance
Open rates, click rates
Daily/weekly metrics
Execs need outcomes and efficiency, not activity details.
3.3 Two Phases: Validate, Then Scale
Outbound isn’t a switch you flip. It’s a motion you build in stages.
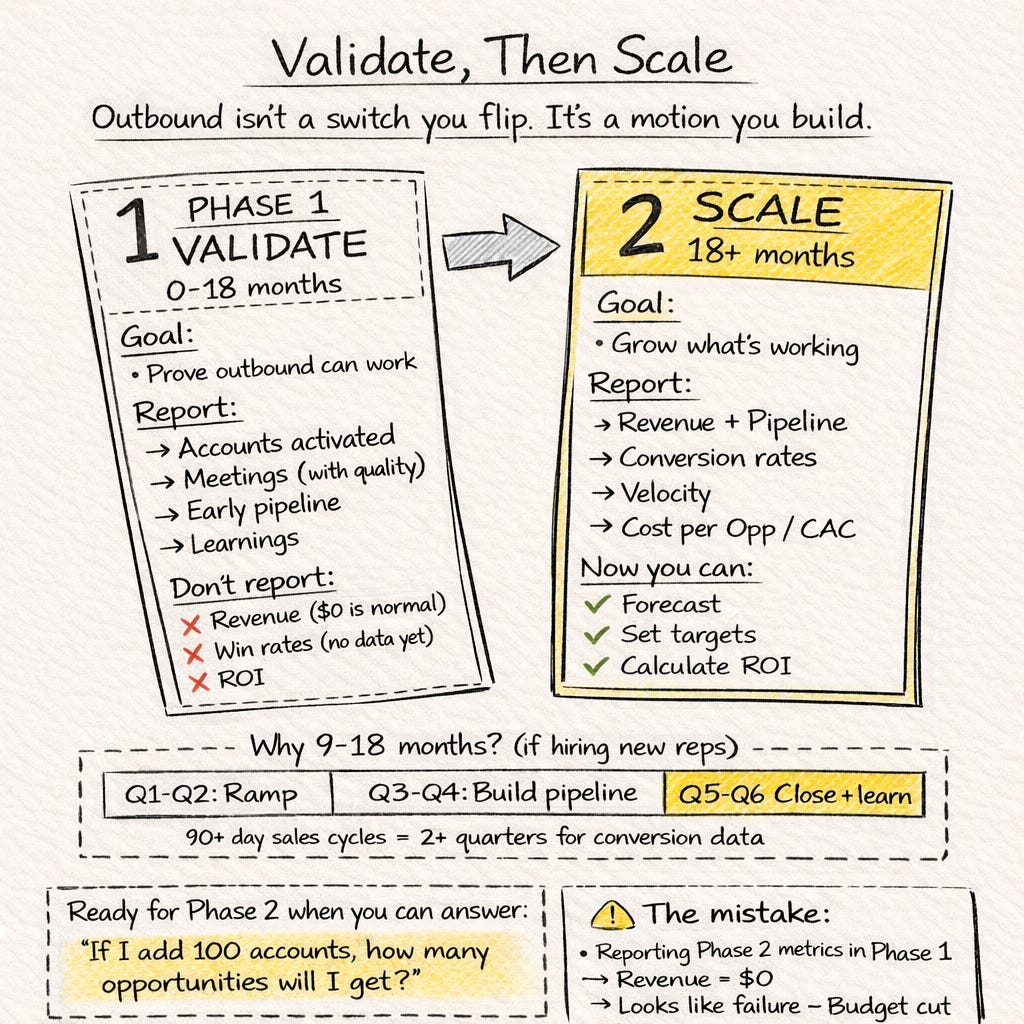
Phase 1: Validate (0-18 months)
The goal isn’t revenue yet. The goal is proving outbound can work for your business.
Why 9-18 months? If you’re hiring new reps: one quarter to ramp, one quarter to build pipeline, one quarter to close. If your sales cycle is 90+ days, you won’t have reliable conversion data for at least two quarters. This is normal.
What to report:
Accounts engaged and activated
Meetings booked (with quality breakdown)
Early pipeline created
Learnings: what’s working, what’s not
What NOT to report:
Revenue (it’s $0, and that’s expected)
Win rates (you don’t have enough data)
ROI (meaningless without conversions)
How to message it:
“We’re in validation mode. Our goal is to build a repeatable playbook. Here’s what we’re learning about our market, and here’s the quality of meetings we’re booking. In [X] months, we’ll have conversion data we can trust.”
You’re done with Phase 1 when you can answer: “If I add 100 accounts, how many opportunities will I get?”
Phase 2: Scale (18+ months)
Now you have data. Now you can talk about efficiency.
What to report:
Revenue and pipeline contribution
Conversion rates at each stage
Pipeline velocity
Cost per opportunity, Outbound CAC
Progress vs. targets
How to message it:
“Outbound is contributing X% of pipeline and Y% of revenue. Velocity is improving. Here’s our path to [target].”
The mistake most teams make:
They try to report Phase 2 metrics during Phase 1. Revenue is $0, so they look like they’re failing. Execs lose confidence. Budget gets cut before the motion has time to work.
Don’t let this happen. Set expectations early: “We’re in validation mode. Here’s our timeline to Phase 2.”
Back to the original question:
“CEOs don’t understand true lead sources and the number of touches needed to convert a lead. They need visibility into outbound work.”
With this framework, they will.
They’ll see what outbound contributes - pipeline AND revenue by source. They’ll understand what it takes - 100+ activities per meeting, the 2x rule for expectations. And they’ll know whether it’s working - conversion rates, velocity, cost per opportunity.
No more mixed funnels. No more unfair comparisons to inbound. No more “why isn’t outbound producing?”
Paid subscribers: I’m working on a Dashboard Recipe, the definitions, formulas, and requirements spec you can hand to your RevOps team to build this in whatever system you use. Keep an eye on your inbox.
Thinking about upgrading to the paid newsletter? Here’s what you’ll get:
Instant access to 40+ paid newsletters, including:
My Outbound Chef Kit: 130+ resources: 20+ email templates, cold call scripts, AI prompts, top outbound tools, and more, everything the best outbound teams use. Worth $1,000+
And the best part? You can try it free for 7 days. Cancel anytime.
But I think you’ll love it!
👉 Start your free trial today.
As soon as you’re ready, here’s how I can help:
Outbound Consulting Call: Need quick help? Book a 40-min session here.
Outbound Private Chef:
Part-time, I’ll build, optimize efficiency, and execute your outbound strategy.
Coaching/Advising: get tailored advice to fix your strategy, boost efficiency, and drive results.
Interested? Reply to this email or hit me up at bonjour@elriclegloire.com
Good Read!